Description
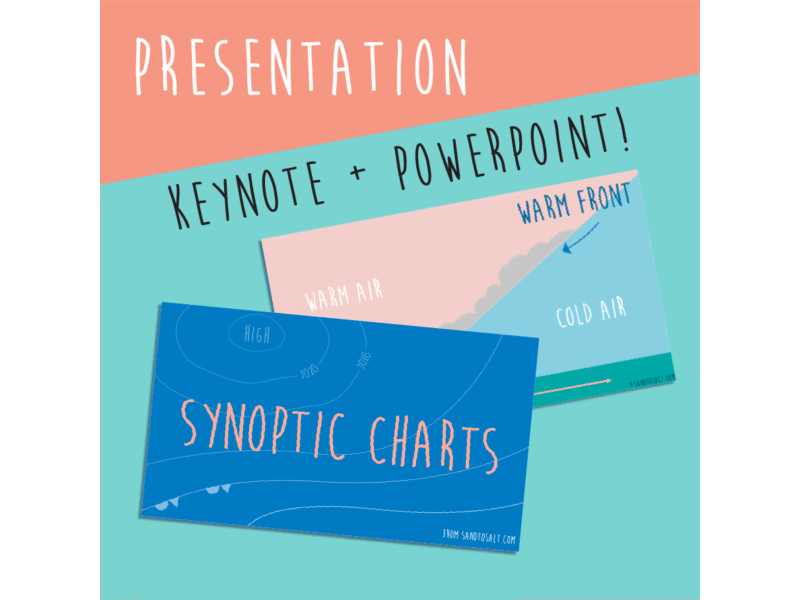
The Sand to Salt Synoptic Charts Presentation.
Learn all about what Synoptic charts are and how to de-code the symbols on them to understand your local weather forecasts.
Synoptic charts can be a bit daunting at first glance, so this presentation aims to take you through all the icons and associated weather easily and logically.
This animated presentation covers all the information covered in our Synoptic Charts poster and is available for both macs and PCs.
Presentation includes:
- Intro to Synoptic charts
- High and Low pressure systems
- Isobars and measurements
- Warm and Cold Frontal weather
- What is the Warm Sector
- Occluded Fronts
- Troughs
Download includes:
1 x Keynote Presentation (Mac software) on Synoptic Charts
1 x Powerpoint Presentation (PC software) on Synoptic Charts
PASSWORD: STS2022
Want more Synoptic Charts resources? Try our Synoptic Charts Poster and test out with our Synoptic Charts Challenge Sheets to see how much you've remembered!
For more on weather... Our Wind direction poster, Windmill activity and Wind indicator crosswords are worth checking out!